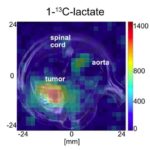
Congratulations to Geoff Topping, Irina Heid, and coauthors on the publication of ‘Hyperpolarized 13C Spectroscopy with Simple Slice-and-Frequency-Selective Excitation’ – the latest publication in our ongoing collaboration with AG Braren of Dept. Radiology, Klinikum rechts Der Isar. In this article, alternating frequency narrow bandwidth (250 Hz) slice-selective excitation was used for 13C spectroscopy at 7 T in a subcutaneous xenograft rat model of human pancreatic cancer (PSN1) to improve quantification while measuring the dynamics of injected hyperpolarized [1-13C]lactate and its metabolite [1-13C]pyruvate. This excitation scheme isolates the small [1-13C]pyruvate peak from the similar-magnitude tail of the much larger injected [1-13C]lactate peak, facilitates quantification of the [1-13C]pyruvate signal, simplifies data processing, and could be employed for other substrates and preclinical models.
Download this open access article here.
Topping, Geoffrey J., et al. “Hyperpolarized 13C Spectroscopy with Simple Slice-and-Frequency-Selective Excitation.” Biomedicines 9.2 (2021): 121.

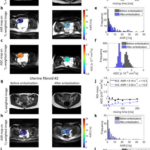
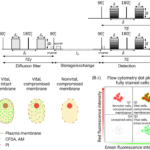
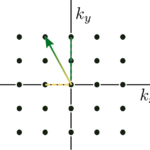
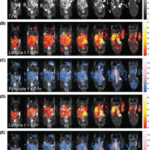
Representative anatomical T2-weighted (rapid acquisition with relaxation enhancement (RARE)) images in sagittal (A) and axial (B) orientations, with oblique spectroscopy slice geometry shown for a subcutaneous tumor (t) in a rat and for a thermal lactate (lac) phantom for transmit power calibration. To measure within the target tumor, with the scanner reference frequency set to that of [1-13C]pyruvate, the slice geometry is prescribed twice: once on the target tumor for [1-13C]pyruvate (yellow-and-red outlines) and again offset by the chemical shift displacement of [1-13C]lactate (dashed yellow outlines). This produces excitations that, at the location of the tumor, alternate between [1-13C]pyruvate and [1-13C]lactate frequencies. An additional slice may also be prescribed (dashed blue outlines) to target lactate in the phantom (solid blue outlines). Carbopol® 980 gel (g, bright contrast) was placed around the tumor to improve its B0 field uniformity. The locations of the 13C surface receive coils (c1 and c2, light blue outlines), muscle (m), and a point-resolved spectroscopy (PRESS) voxel (white box surrounding t) for shimming on proton signal within the tumor are also marked. Magnitude spectra (C) from [1-13C]lactate in the phantom (blue) and from hyperpolarized [1-13C]lactate in the tumor (yellow) after injection, exhibiting a frequency shift between the two sources of lactate signal. In cases where this shift is large, the placement of a slice prescribed to measure within the phantom may benefit from additional spatial offset to compensate for that frequency shift in order to excite the 13C in the phantom.


![Parahydrogen-Polarized [1-13C]Pyruvate for Reliable and Fast Preclinical Metabolic Magnetic Resonance Imaging](https://schillinglab.com/wp-content/uploads/2023/09/advs6326-fig-0001-m-150x150.jpg)