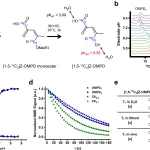
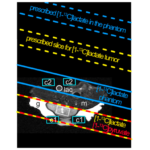
Congratulations to Martin Grashei and coauthors on the publication of their article ‘pH Dependence of T2 for Hyperpolarizable 13C-Labelled Small Molecules Enables Spatially Resolved pH Measurement by Magnetic Resonance Imaging’ in Pharmaceuticals.
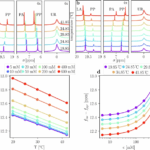
Hyperpolarized 13C magnetic resonance imaging often uses spin-echo-based pulse sequences that are sensitive to the transverse relaxation time T2. In this context, local T2-changes might introduce a quantification bias to imaging biomarkers. Here, we investigated the pH dependence of the apparent transverse relaxation time constant (denoted here as T2) of six 13C-labelled molecules. We obtained minimum and maximum T2 values within pH 1–13 at 14.1 T: [1-13C]acetate (T2,min = 2.1 s; T2,max = 27.7 s), [1-13C]alanine (T2,min = 0.6 s; T2,max = 10.6 s), [1,4-13C2]fumarate (T2,min = 3.0 s; T2,max = 18.9 s), [1-13C]lactate (T2,min = 0.7 s; T2,max = 12.6 s), [1-13C]pyruvate (T2,min = 0.1 s; T2,max = 18.7 s) and 13C-urea (T2,min = 0.1 s; T2,max = 0.1 s). At 7 T, T2-variation in the physiological pH range (pH 6.8–7.8) was highest for [1-13C]pyruvate (ΔT2 = 0.95 s/0.1pH) and [1-13C]acetate (ΔT2 = 0.44 s/0.1pH). Concentration, salt concentration, and temperature alterations caused T2 variations of up to 45.4% for [1-13C]acetate and 23.6% for [1-13C]pyruvate. For [1-13C]acetate, spatially resolved pH measurements using T2-mapping were demonstrated with 1.6 pH units accuracy in vitro. A strong proton exchange-based pH dependence of T2 suggests that pH alterations potentially influence signal strength for hyperpolarized 13C-acquisitions.
Download the open access article here.
Grashei, Martin et al. “pH Dependence of T2 for Hyperpolarizable 13C-Labelled Small Molecules Enables Spatially Resolved pH Measurement by Magnetic Resonance Imaging.” Pharmaceuticals 14.4 (2021): 327. Crossref. Web.
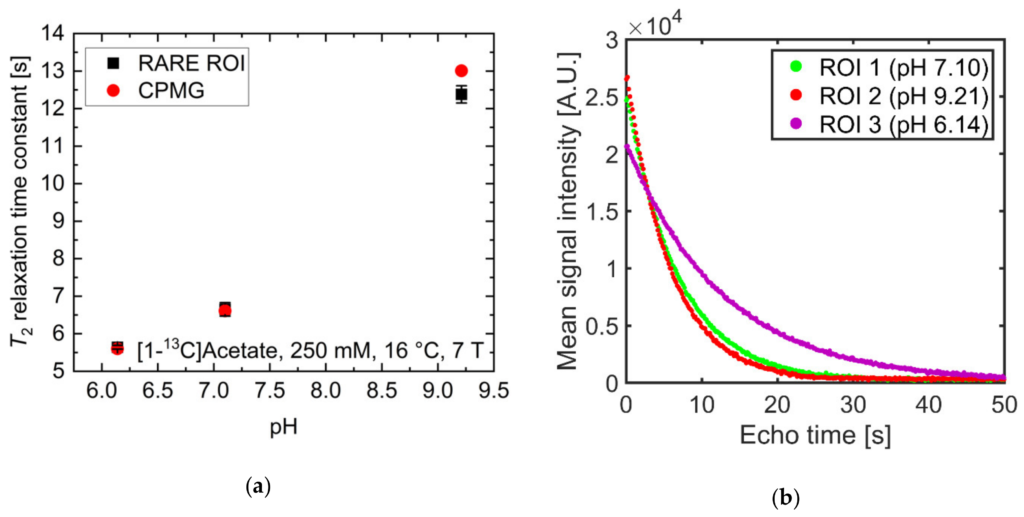
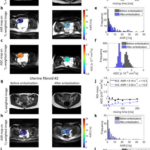
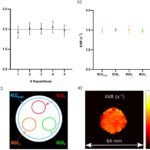
(a) Comparison of T2 values of [1-13C]acetate measured with a Carr-Purcell-Meiboom-Gill (CPMG) sequence separately for each tube (red) and derived from averaging T2 values within regions of interest analysis of T2 maps generated from rapid acquisition with relaxation enhancement (RARE) imaging data (black). Mean relaxation times show good agreement between acquisition modalities, despite RARE-derived T2 values for each tube being slightly shorter than the corresponding CPMG-derived values. (b) Echo trains in tubes of different pH values. Signal curves were derived from echo images and averaged across regions of interest (green, red, or magenta). They show good preservation of transversal magnetization in later echoes. (c) T2 map generated from voxel-wise mono-exponential fitting of echo trains, showing homogeneity within and high contrast between tubes. (d) pH map generated using an estimated linear relationship between T2 and pH, derived from the titration curve in Figure 2a. In this manner, the pH of the tubes can be estimated with 0.1 pH unit intra-tube voxel-by-voxel variation and with an absolute accuracy of 1.6 pH units.

![Parahydrogen-Polarized [1-13C]Pyruvate for Reliable and Fast Preclinical Metabolic Magnetic Resonance Imaging](https://schillinglab.com/wp-content/uploads/2023/09/advs6326-fig-0001-m-150x150.jpg)